Glucose Curve Calculator
Enter your diabetic dog's blood glucose readings to generate a glucose curve. Identify nadir, peak, and insulin regulation patterns at home.
Open TrackerGenerate a glucose curve for your diabetic cat by entering home blood glucose readings. Identify trends and share results with your vet.
Record the current measurement or event details in Blood Glucose Curve Generator. The result turns them into a clearer log so changes are easier to compare over time.
Managing a diabetic cat or dog requires more than just administering insulin twice a day. It requires monitoring whether the insulin dose is actually working. A blood glucose curve is the tool veterinarians and informed pet owners use to assess how blood sugar levels change throughout the day in response to insulin therapy. The Blood Glucose Curve Generator takes your serial blood glucose readings and plots them into a visual curve, helping you identify the nadir (lowest glucose point), duration of insulin action, and whether your pet's dose needs adjustment.
AAHA strongly recommends obtaining blood glucose curves at home when caregivers can do so safely, especially for cats because stress hyperglycemia in a clinic can skew results. Curves still need veterinary interpretation.
A blood glucose curve (BGC) is a series of blood sugar measurements taken every 1-2 hours over a 12-hour period (one full insulin cycle). The data points are plotted on a graph to show: the pre-insulin baseline glucose level, when glucose starts dropping after the insulin injection, the nadir (the lowest blood glucose point reached), and how quickly glucose returns to baseline.
For cats and dogs on insulin, the curve tells you whether the current dose is controlling diabetes effectively or whether it needs to be increased, decreased, or the timing adjusted.
Use the table below to compare Normal Blood Glucose Reference Ranges.
| Parameter | Dogs (Target Range) | Cats (Target Range) | Concern Level |
|---|---|---|---|
| Pre-insulin (baseline) | 150-250 mg/dL | 200-300 mg/dL | Normal fasting diabetic range |
| Nadir (lowest point) | 80-150 mg/dL | 80-150 mg/dL | Target zone - safe and effective |
| Hypoglycemia warning | Below 80 mg/dL | Below 80 mg/dL | Emergency - contact vet immediately |
| Severe hypoglycemia | Below 50 mg/dL | Below 50 mg/dL | Life-threatening emergency |
| Persistent hyperglycemia | Above 400 mg/dL | Above 400 mg/dL | Dose may be insufficient |
| Glucose nadir timing | 5-8 hours post-injection | 4-6 hours post-injection | Varies by insulin type |
Use the table below to compare Insulin Types and Expected Curve Profiles.
| Insulin Type | Species | Onset of Action | Peak Effect (Nadir) | Duration | Common Brand |
|---|---|---|---|---|---|
| Glargine (Lantus) | Cats primarily | 1-2 hours | 6-10 hours | 12-24 hours | Lantus, Basaglar |
| ProZinc | Cats | 1-4 hours | 5-8 hours | 10-14 hours | ProZinc |
| NPH | Dogs primarily | 0.5-3 hours | 2-6 hours | 6-12 hours | Humulin N |
| Vetsulin (Lente) | Dogs and cats | 0.5-2 hours | 2-6 hours | 8-14 hours | Vetsulin / Caninsulin |
| Detemir | Dogs and cats | 1-4 hours | Variable | 14-24 hours | Levemir |
| PZI | Cats | 1-4 hours | 4-8 hours | 12-16 hours | Pro-Zinc |
A well-regulated diabetic pet shows a curve where: blood glucose starts in the 200-300 mg/dL range, drops smoothly to a nadir of 80-150 mg/dL around mid-cycle, then gradually returns to baseline by the next injection time. The pet is symptom-free, eating well, and maintaining stable weight.
If the nadir drops below 80 mg/dL, the body releases stress hormones (cortisol, glucagon, adrenaline) that spike blood sugar dramatically. The post-nadir glucose may look extremely high (above 400 mg/dL), falsely suggesting the insulin dose needs increasing. In reality, the dose may need to be reduced. This is called the Somogyi effect and can only be identified through a full glucose curve.
If the curve shows very little drop from baseline (nadir remains above 250-300 mg/dL), the current dose may be too low, the insulin may have expired or been improperly stored, the injection site may have been missed, or there may be concurrent illness causing insulin resistance.
If blood glucose returns to high levels well before the next injection is due, the insulin duration may be too short for your pet. Your vet may consider switching insulin types or adjusting injection frequency.
Use the table below to compare How Often Should You Run a Glucose Curve?.
| Situation | Recommended Frequency |
|---|---|
| Newly diagnosed diabetic pet | Every 7-14 days until stable |
| After any dose change | 7-10 days after the change |
| Stable, well-regulated pet | Every 3-6 months |
| Any clinical signs of change | Immediately (lethargy, vomiting, increased thirst) |
| Concurrent illness or stress | During the illness and 1-2 weeks after recovery |
Studies in veterinary medicine have shown that blood glucose levels in cats especially are significantly elevated when measured in a clinic setting due to stress (white-coat hyperglycemia). A 2012 study published in the Journal of Feline Medicine and Surgery found that home glucose monitoring produced more reliable curves than in-clinic sampling in 80% of diabetic cats tested. Home curves reflect your pet's real-world glucose regulation in their familiar, stress-free environment.
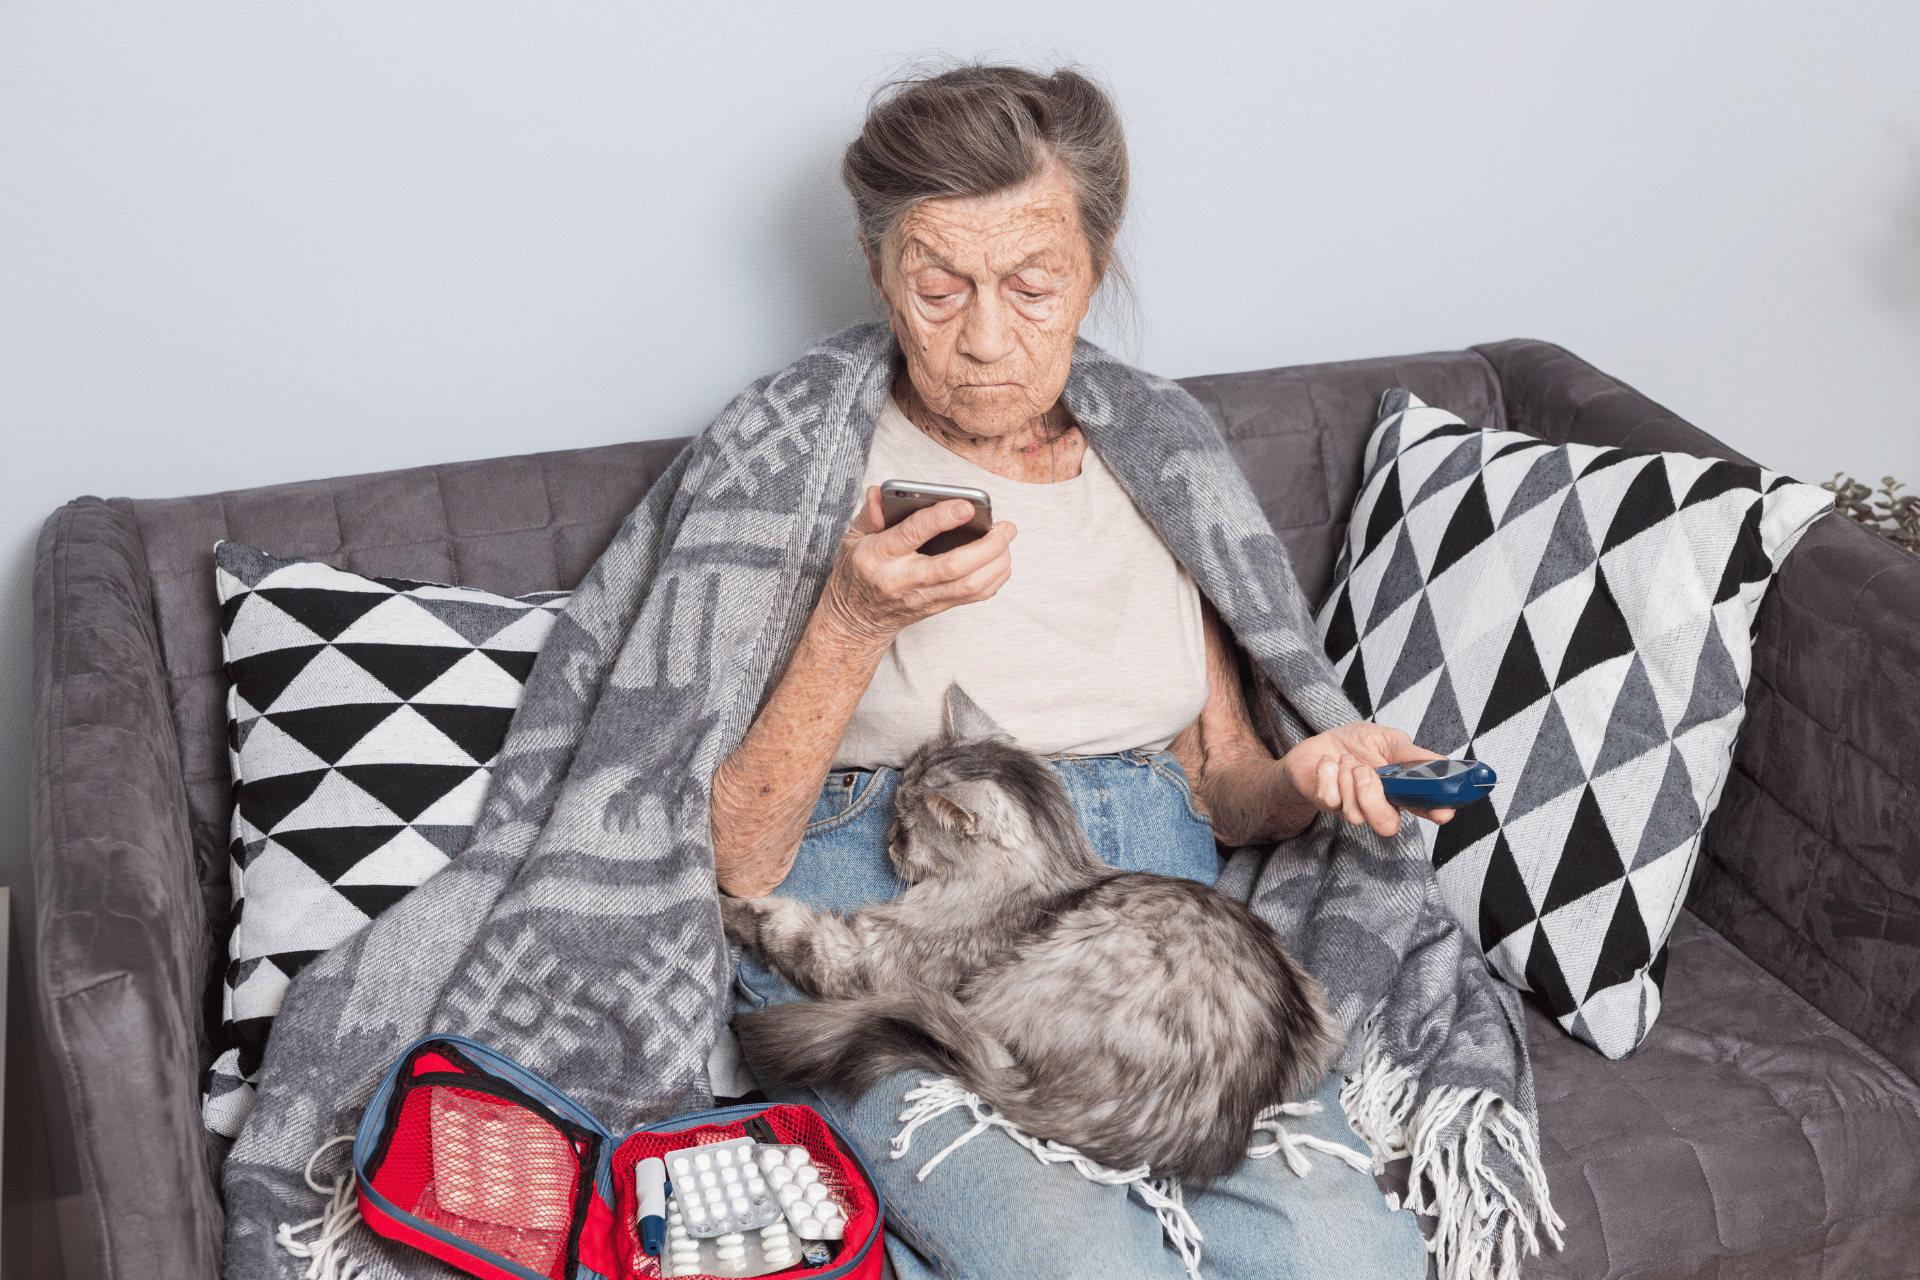
Human glucometers are not calibrated for cat or dog blood, which has different ratios of glucose in red blood cells versus plasma. The AlphaTrak 3 (and AlphaTrak 2) are specifically calibrated for pets and are strongly recommended for accuracy.
The ear pinna is the least invasive site for most cats. Warm the ear slightly beforehand to improve blood flow. For dogs, the lip margin or paw pad are easier. With patience and treats, most pets adapt to the process within a few sessions.
This is a hypoglycemic emergency. Rub corn syrup or honey on the gums immediately, keep the pet warm, and contact your veterinarian or emergency clinic. Do not give the next insulin dose until you have spoken to a vet.
A single glucose curve taken on one day may not reflect every day. Stress, activity variation, food intake, and illness all affect results. A persistently symptomatic pet with a seemingly normal curve warrants repeat testing and a thorough veterinary evaluation including fructosamine levels, which reflect average glucose over 2-3 weeks.
Enter each time point and its corresponding blood glucose reading in mg/dL (or mmol/L). The generator automatically plots the curve and highlights the nadir, baseline, and any readings in the hypoglycemic danger zone.
Note: Use glucose curve results as a record to discuss with your veterinarian, especially before changing food, insulin, or routine.
Continue with Glucose Curve Calculator, Dog & Cat Food Calculator: Your Pet Feeding Guide, Free Carbohydrate Calculator for Cat Food for the next practical step.
Enter your diabetic dog's blood glucose readings to generate a glucose curve. Identify nadir, peak, and insulin regulation patterns at home.
Open Tracker
Calculate the right daily food portion for your dog based on weight, age, and activity level. Supports dry, wet, and mixed feeding for accurate portions.
Use Calculator
Calculate how much water your dog or cat needs per day based on weight, diet, and activity. Spot dehydration risks and keep your pet healthy.
Use Calculator